Annual Electricity Use (to Scale) — Methodology & Research Notes
Joshua Shew · @joshuashew.bsky.social · March 2026
What this chart shows
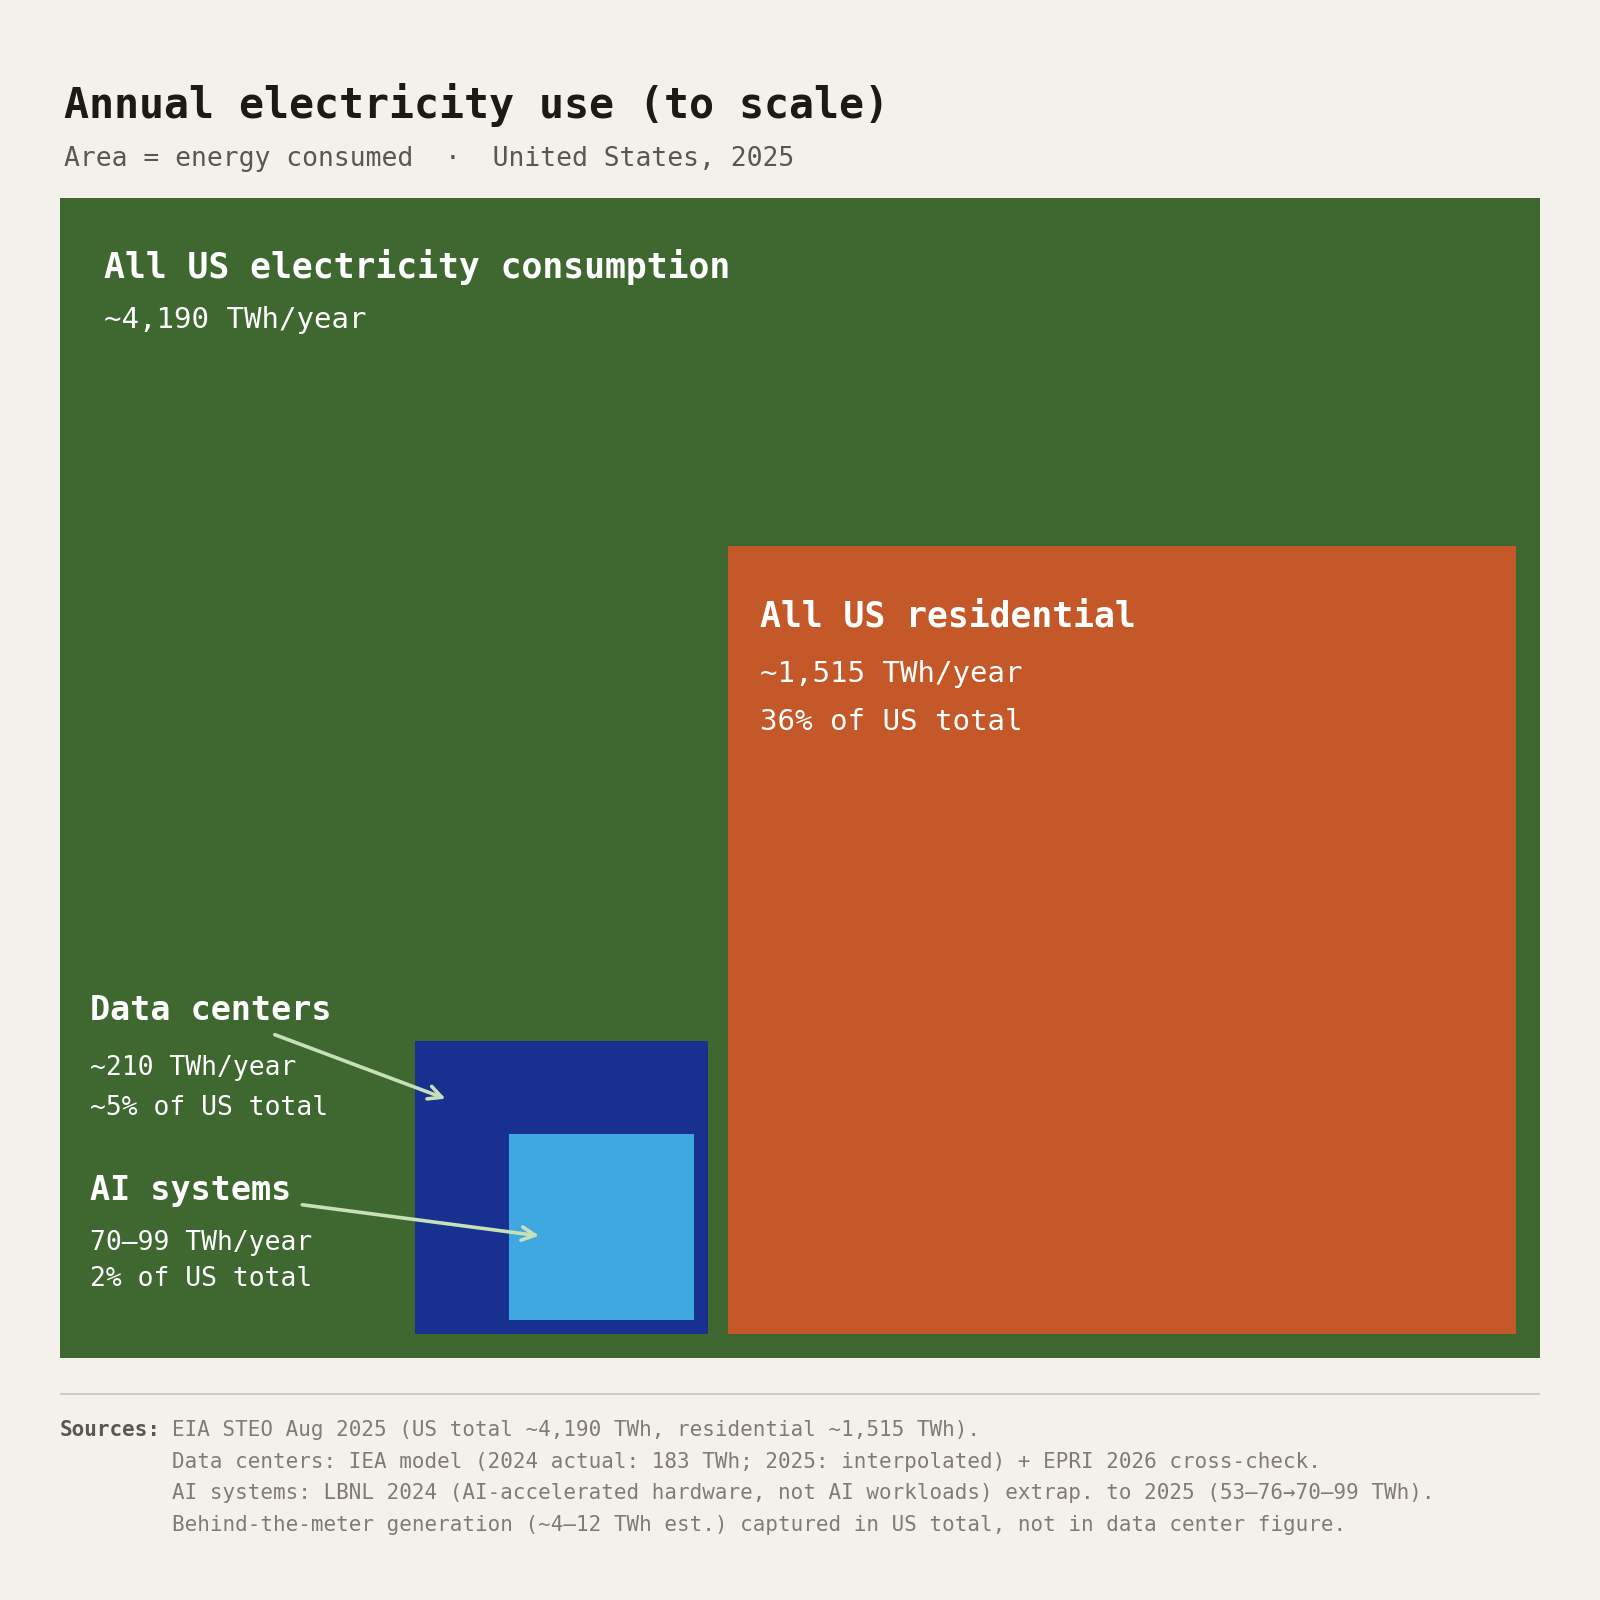
Each box's area is directly proportional to the electricity it represents. The nesting shows containment: AI systems are a subset of data center load, which is a subset of all US consumption. Residential is shown separately for comparison — it is the largest single-sector figure most people have a personal sense of.
The residential and US-total figures are EIA actuals with high confidence. The data center figure is a model-based estimate from two independent methodologies converging at the same range. The AI systems figure is a single-source extrapolation — the best available published figure, but not confirmed by independent measurement.
Data by box
All US electricity · ~4,190 TWh/year
Confidence: High · EIA actuals
EIA STEO Aug 2025 retail sales forecast. Confirmed by Mar 2026 STEO: 2025 net generation = 4,430 TWh; retail sales ≈ 4,186–4,193 TWh (generation minus ~6% transmission loss). The chart uses consumption, not generation — this distinction matters for the percentage figures.
US residential · ~1,515 TWh/year
Confidence: High · EIA actuals
EIA STEO Aug 2025 residential sector projection. Residential grew 2.2% in 2025 over 2024. 1,515 / 4,190 = 36.2%.
US data centers · ~210 TWh/year
Confidence: Medium-high · two independent estimates
IEA model: 2024 actual = 182.61 TWh; 2025 projection = "well over 200 TWh." EPRI Powering Intelligence 2026: state-level capacity accounting gives "4–5% of US electricity" → 168–210 TWh. These methodologies are independent (equipment model vs. state capacity accounting) and converge at 200–220 TWh. Chart uses 210 TWh as midpoint. No 2025 measured figure exists; mandatory disclosure is not required under current US law.
AI systems · 70–99 TWh/year
Confidence: Low · single-source extrapolation
LBNL 2024 report (MIT Tech Review partnership): AI-accelerated hardware used 53–76 TWh in 2024 in US data centers. Extrapolated at 30%/yr (IEA's projected growth rate for AI-accelerated servers) to 2025 → 69–99 TWh. Midpoint 84 TWh used for box sizing.
Scope note: counts electricity consumed by AI-accelerated hardware (GPUs/TPUs), not AI workloads specifically. Gartner's global AI-optimized server figure (93 TWh worldwide in 2025) implies US-only AI workload energy of ~37–50 TWh — roughly half of LBNL's figure. The gap is definitional, not a factual conflict.
Research methodology
Source selection
28 sources were consulted over multiple research sessions, organized into a structured annotated bibliography. Primary sources were government agencies (EIA, IEA, CRS) and federally funded research (LBNL, EPRI). Secondary sources included peer-reviewed analysis (Kamiya & Coroamă 2025 meta-analysis; Mytton & Ashtine 2022 methodology review), investigative journalism with original analysis (MIT Technology Review May 2025, conducted in partnership with the LBNL team), and industry-facing research organizations (Gartner, Epoch AI/EPRI).
Cross-verification approach
For the data center figure, two methodologically independent estimates were required before settling on a point estimate. The IEA uses a bottom-up equipment model; EPRI uses state-level capacity accounting. They agree at 200–220 TWh for 2025. An independent cross-check was conducted using Dario Amodei's GW figures from his February 2026 Dwarkesh podcast appearance and Dylan Patel's March 2026 figures — converted to TWh using PUE and capacity factor assumptions — which corroborate the LBNL AI figure order of magnitude from entirely separate supply-chain data.
Falsification checks
Explicit falsification research was conducted in both directions: sources suggesting the AI figure is overestimated (Gartner's global figure; the hardware-capacity vs. workload-energy distinction; LBNL's own acknowledgment of methodology limitations) and sources suggesting it is underestimated (EPRI's 60% upward revision history; BTM generation gap; Epoch AI/EPRI finding that net AI power grows 2.2–2.9×/yr despite 40%/yr hardware efficiency gains). The SIFT fact-checking framework was applied to the published claims.
Key methodological decisions
Area-proportional squares. The design uses area, not length or height, as the visual variable. Area is the correct mapping for proportional comparison of a scalar quantity. The visual consequence — that the AI box looks "small" even at 84 TWh — is accurate and is the point.
Retail consumption vs. generation. The chart uses retail sales (~4,190 TWh), not net generation (~4,430 TWh). Retail sales represent what customers actually consume and is the denominator used in sector percentages throughout the literature. Using generation would make the percentage figures inconsistent with cited sources.
Behind-the-meter generation. AI data centers operating their own gas generation (e.g., xAI Colossus, ~500 MW–1.5 GW estimated operational in 2025) consume electricity that does not flow through grid metering. EIA captures large BTM generators (≥1 MW via Form EIA-860) in its "direct use" category — so this load is included in the US total green box. LBNL and IEA measure grid-side consumption only — so it is excluded from the data center blue box. Estimated magnitude: ~4–12 TWh in 2025, growing rapidly.
Uncertainty & limitations
No measured 2025 figures exist for data centers or AI systems. The US has no mandatory energy disclosure requirement for data centers (Clean Cloud Act of 2025, S. 1475, was introduced but not enacted as of March 2026). All figures depend on equipment shipment data, voluntary corporate disclosures, and model assumptions. The IEA explicitly acknowledges "substantial uncertainty both about data centre consumption today and in the future." LBNL deliberately presents projections as a range rather than a point estimate for the same reason.
The EIA figures (US total and residential) are high-confidence: government statistical data with near-actual 2025 values confirmed by the March 2026 STEO release.
The data center figure has genuine cross-source support. The two-independent-methodology convergence is meaningful. The remaining uncertainty is about whether 2025 growth was closer to IEA's base rate (~13%) or higher.
The AI systems figure is the chart's weakest claim. The LBNL hardware model is the most defensible published methodology for this quantity, but it produces estimates roughly twice as high as what Gartner's global AI server figure implies for US-only workloads. That discrepancy is fully explained by the definitional difference (all hardware capacity vs. actual AI workload energy), but readers who encounter both figures without that context will see an apparent contradiction.
Key sources
28 sources were consulted. The entries below are those directly cited in the chart.
[1] IEA, Energy and AI (April 2025) Primary source for US data center 2024 actual (183 TWh) and 2025 projection (>200 TWh). Equipment-model methodology; scenario-based for 2025+. iea.org/reports/energy-and-ai
[2] Shehabi et al., 2024 US Data Center Energy Usage Report, LBNL (Dec 2024) Primary source for AI-accelerated server electricity estimate (53–76 TWh in 2024). Bottom-up equipment model, DOE-commissioned. The AI figure in this chart is an extrapolation of this 2024 estimate. eta-publications.lbl.gov
[3] O'Donnell & Crownhart, MIT Technology Review (May 2025) Conducted in partnership with the LBNL team; provides the AI-specific isolation (53–76 TWh) from total DC electricity. Original reporting with ~24 expert interviews. technologyreview.com
[7] Epoch AI / EPRI, Scaling Intelligence (August 2025) Net AI power grows 2.2–2.9×/yr despite 40%/yr efficiency gains — used to verify that our 30%/yr extrapolation is conservative, not an overestimate. epoch.ai
[23] EIA STEO (multiple vintages: Aug 2025, Mar 2026) US total electricity consumption (~4,190 TWh) and residential (~1,515 TWh). Government statistical data; 2025 actuals confirmed in Mar 2026 STEO. eia.gov
[24] IEA year-by-year US data center data (via Rigzone, Nov 2025) IEA model data shared with Rigzone: 2024 = 182.61 TWh; 2025 = "well over 200 TWh." Used for IEA interpolation to 2025. rigzone.com
[25] EPRI, Powering Intelligence 2026 (February 2026) State-level capacity accounting; "4–5% of US electricity" for data centers in current period → 168–210 TWh. Independent methodology from IEA; convergence is meaningful. epri.com
[26] Gartner, Data Center Electricity Demand 2025–2030 (November 2025) Global AI-optimized server electricity: 93 TWh worldwide in 2025. Used as falsification check on AI figure — implies US-only AI workload energy of ~37–51 TWh, roughly half the LBNL-based estimate. Discrepancy is definitional. gartner.com
[27] Dario Amodei, Dwarkesh Podcast (February 13, 2026) "10–15 GW industry AI compute built in 2026; 3×/yr growth." GW→TWh conversion yields ~41–66 TWh for frontier AI in 2025 — corroborates LBNL order of magnitude from supply-chain data. dwarkesh.com
[28] Dylan Patel, Dwarkesh Podcast (March 13, 2026) "~20 GW US incremental 2026; Anthropic + OpenAI at 2–2.5 GW each." Anthropic + OpenAI alone → ~37 TWh/yr in 2026, independent supply-chain corroboration. dwarkesh.com
AI process disclosure
This chart and document were produced using Claude Sonnet 4.6 in the Claude.ai web interface over multiple sessions. Total user messages in the visualization sessions: ~180, including ~40 "continue" prompts when Claude reached per-turn tool use limits.
Research. Claude conducted web searches and retrieved source documents; I directed the research agenda, specified which sources to retrieve, evaluated source quality, and made all judgment calls about confidence levels and methodological limitations. The annotated bibliography (28 entries) was built iteratively — Claude drafted entries; I corrected framing errors and added caveats. The Gartner-LBNL discrepancy and the BTM accounting gap were identified through explicit falsification prompting on my part.
Visualization. Claude wrote and iterated all Python/matplotlib code. I specified every design decision — color palette, layout, label placement, typography, proportionality encoding — and provided correction feedback throughout. Claude ran pixel-level verification and geometry checks; I reviewed actual rendered images to catch errors that the automated checks missed.
This document. Claude generated this Markdown from the accumulated research notes and bibliography. I specified the structure and content scope; the writing reflects the accumulated source notes rather than Claude's independent synthesis.
What Claude did not do: select sources, assess credibility independently, determine confidence levels, make design decisions, or write any claim not traceable to a retrieved primary source.
